How to read three tabs in a driver's profile: the Loads tab lists every load the driver has hauled, the Stats tab shows how the driver is performing, and the Mileage tab shows the miles driven in each state. Use them to check a driver's work, answer "how many miles did this driver drive?" and spot problems early.
Who can do this: users with access to Drivers. A tab only appears if your user has access to it.
Before you begin
- Loads: a load appears on this tab only when the driver is assigned to at least one of its stops. If a load is missing, check the Driver on the stops of the load.
- Mileage: the miles by state are calculated for each load that has at least two stops, using the location of the stops and the driver assigned to them. They are recalculated when the stops of a load change.
Open the tabs
Open Drivers, select the driver number, then select Loads, Stats or Mileage in the tab bar. See Driver profile: all tabs at a glance.

Loads tab
The Loads tab lists the loads the driver was dispatched on, newest first. A load shared by two drivers appears for both, with the amounts that belong to this driver.
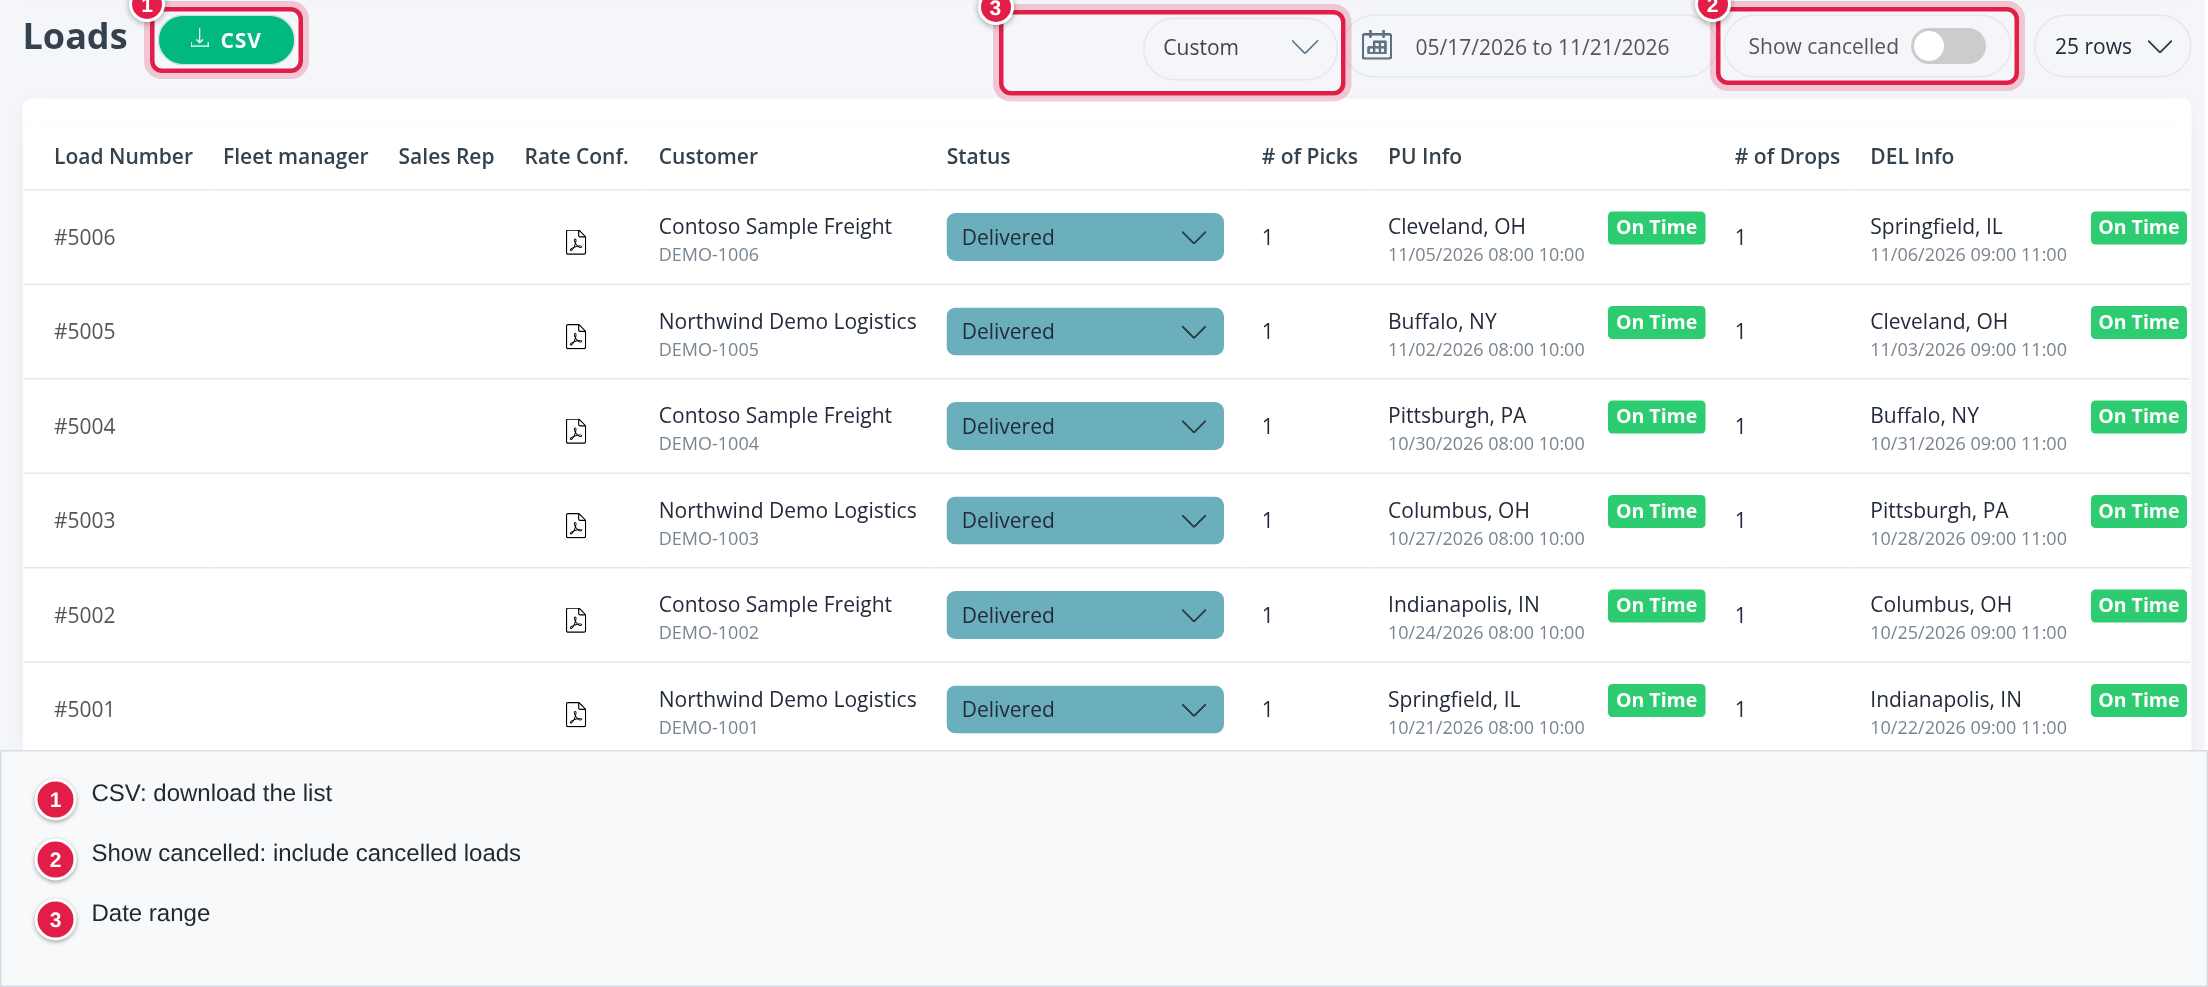
At the top right of the tab:
- CSV: download the list as a file.
- Date range: choose Custom dates or a preset such as This week, Last month or This year. The list opens on about the last 25 weeks.
- Show cancelled: turn on to include cancelled loads. They are left out by default.
- 25 rows: how many rows to show per page.
The columns
| Column | What it shows |
|---|---|
| Load Number | The load number. Select it to open the load in a new tab |
| Fleet manager | The driver's fleet manager on the load |
| Sales Rep | The sales rep of the load |
| Rate Conf. | An icon that opens the rate confirmation, when one is uploaded |
| Customer | The customer and the customer's own load number below it |
| Status | The load status, in colour |
| # of Picks and PU Info | How many pick-ups the driver has, and the first one: city, state, appointment date and time, and whether it was On Time |
| # of Drops and DEL Info | How many deliveries the driver has, and the last one, in the same way |
| Linehaul, FSC and LH+FSC | The linehaul, the fuel surcharge and the two together |
| Detention | Detention charged on the load |
| Empty Miles, Loaded Miles and Total Miles | Miles the driver drove empty, loaded and in total |
| $ per mile | Revenue per mile |
Status is a list, not just a label. Choosing another status in it changes the status of the load itself.
The table is wide. Scroll it sideways to reach the money and mile columns on the right.
Stats tab
The Stats tab gathers the driver's performance in cards on the left and charts on the right. The figures are calculated by the system from the driver's loads and statements.
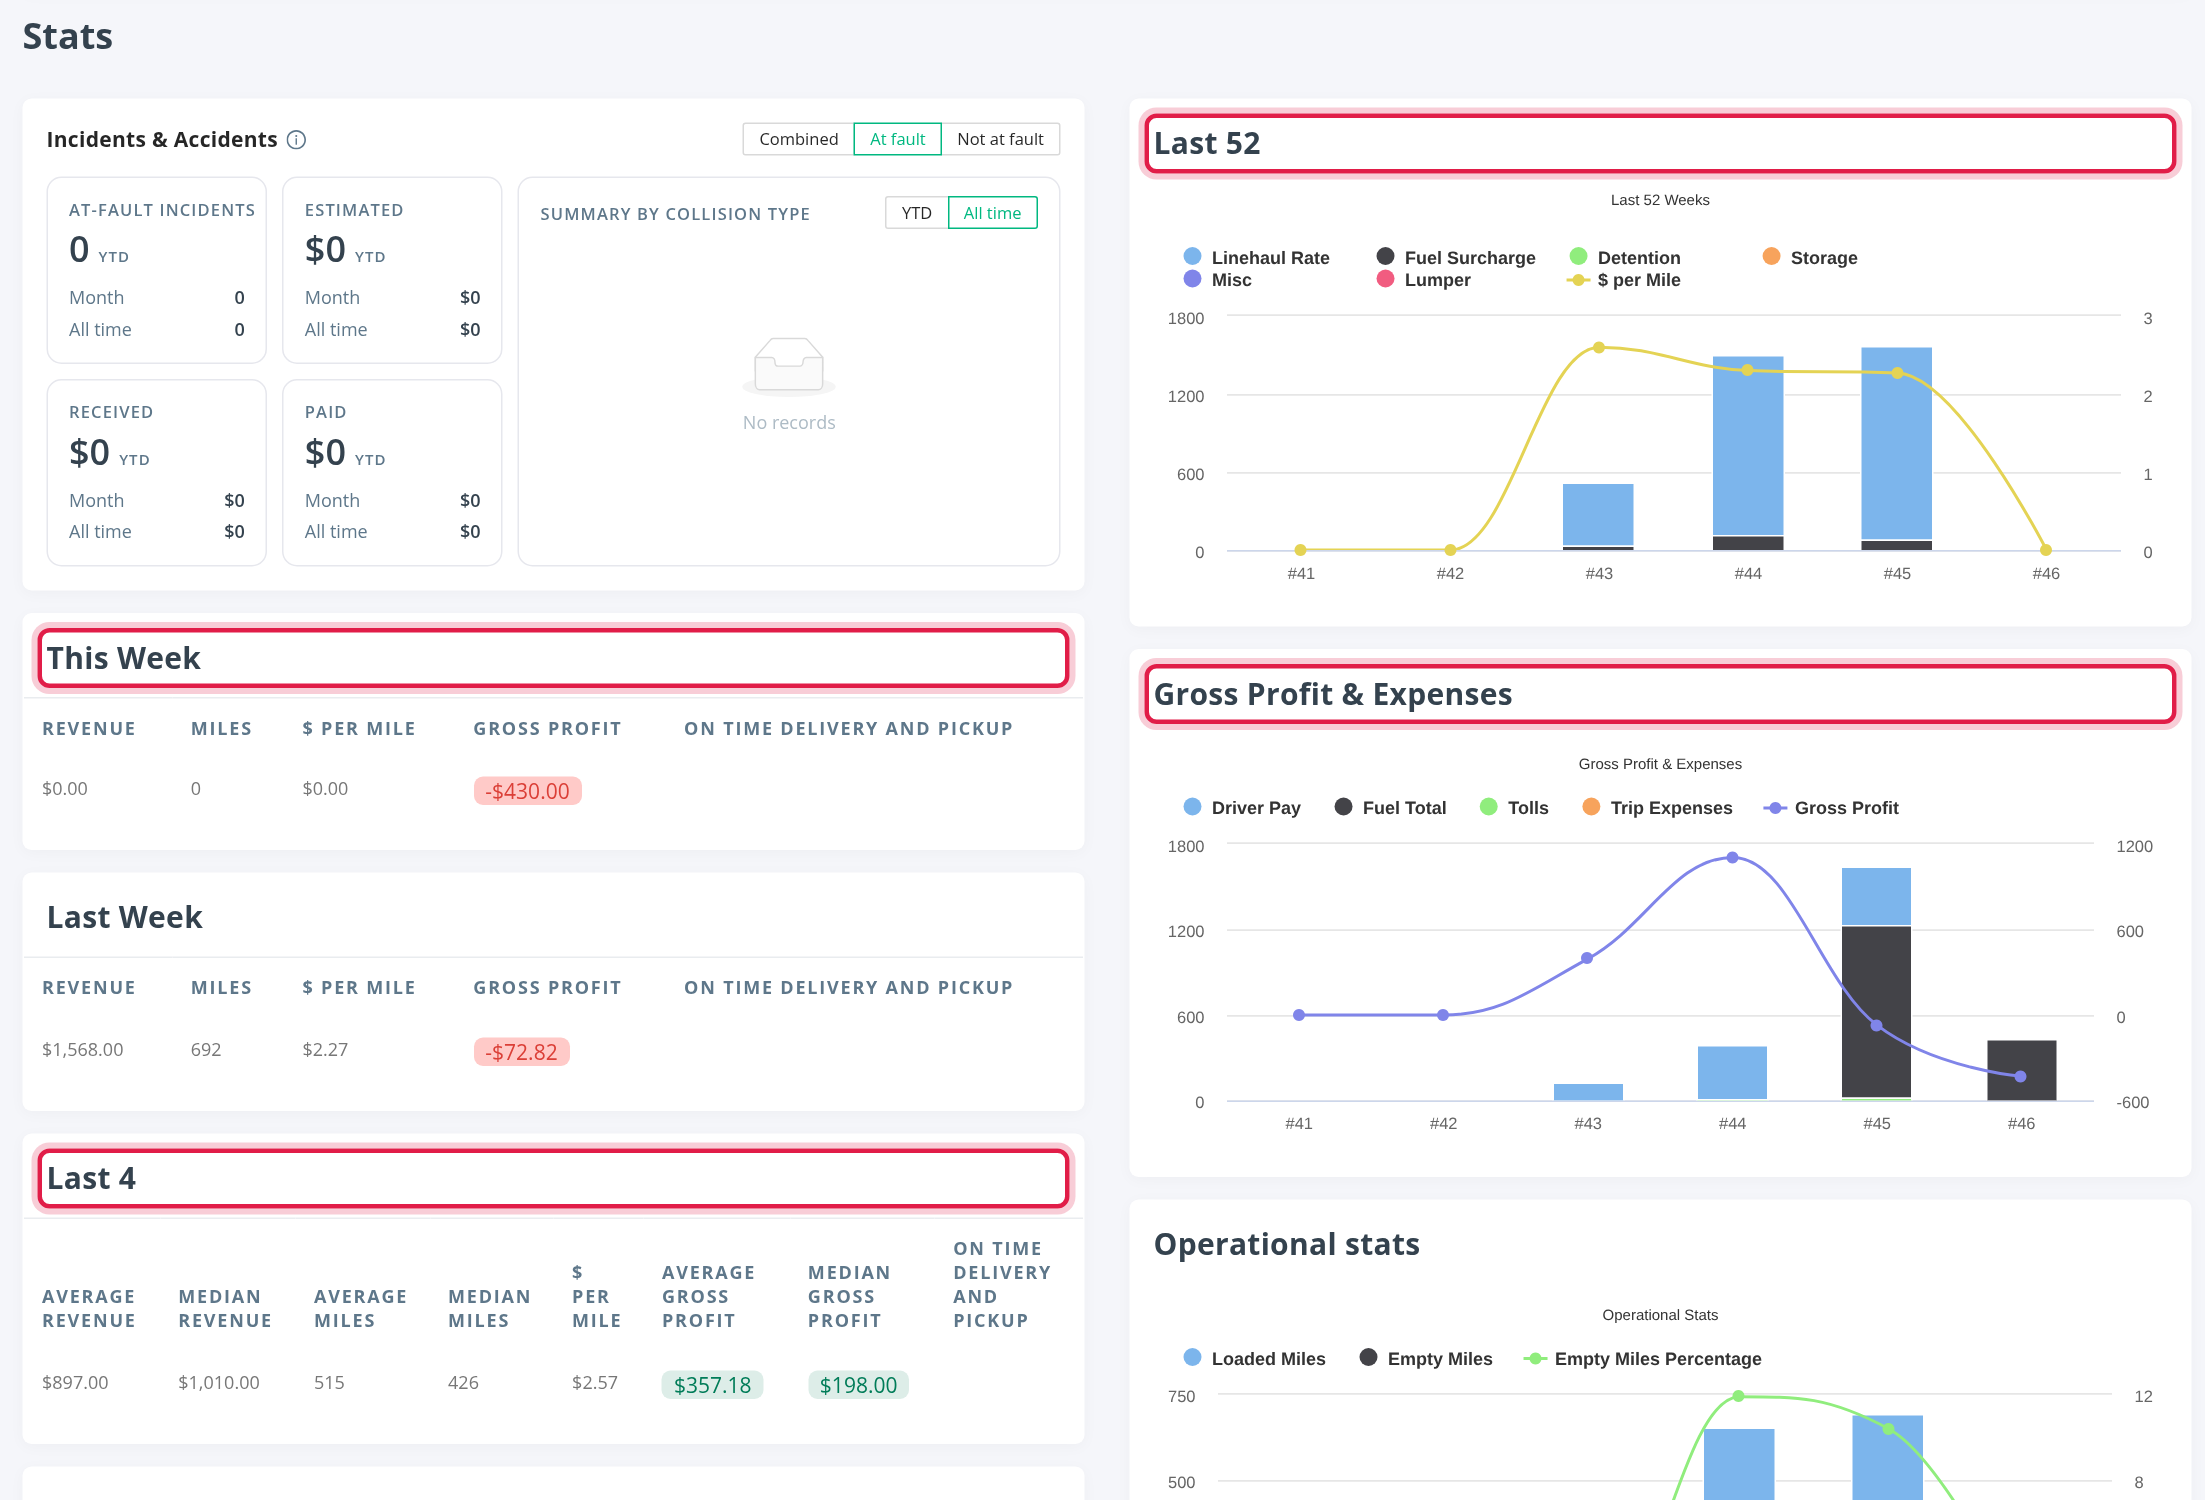
On the left
- Incidents & Accidents: switch between Combined, At fault and Not at fault. It shows the incidents, the estimated, received and paid amounts for this year, this month and all time, and a Summary by collision type with YTD and All time.
- This Week and Last Week: Revenue, Miles, $ per mile, Gross profit and On time delivery and pickup.
- Last 4, Last 8, Last 13, Last 26 and Last 52: the average and the median Revenue, the average and the median Miles, $ per mile, the average and the median Gross profit and On time delivery and pickup over that many weeks before this week.
- Rolling average of haul: the average Miles per load over the last 4 and the last 8 weeks. It appears once the driver has statements.
- Off Duty Summary: how many off-duty events of each kind the driver had in the week you choose. It says "No events this week" when there are none.
On the right
- Last 52: the weekly Linehaul Rate, Fuel Surcharge, Detention, Storage, Misc and Lumper, with $ per Mile as a line.
- Gross Profit & Expenses: the weekly Driver Pay, Fuel Total, Tolls and Trip Expenses, with Gross Profit as a line.
- Operational stats: Loaded Miles, Empty Miles and the Empty Miles Percentage.
- Service Level: the weeks when the driver's on-time rate was OTD ≥ 95% or OTD < 95%.
Gross profit is red when it is negative.
Mileage tab
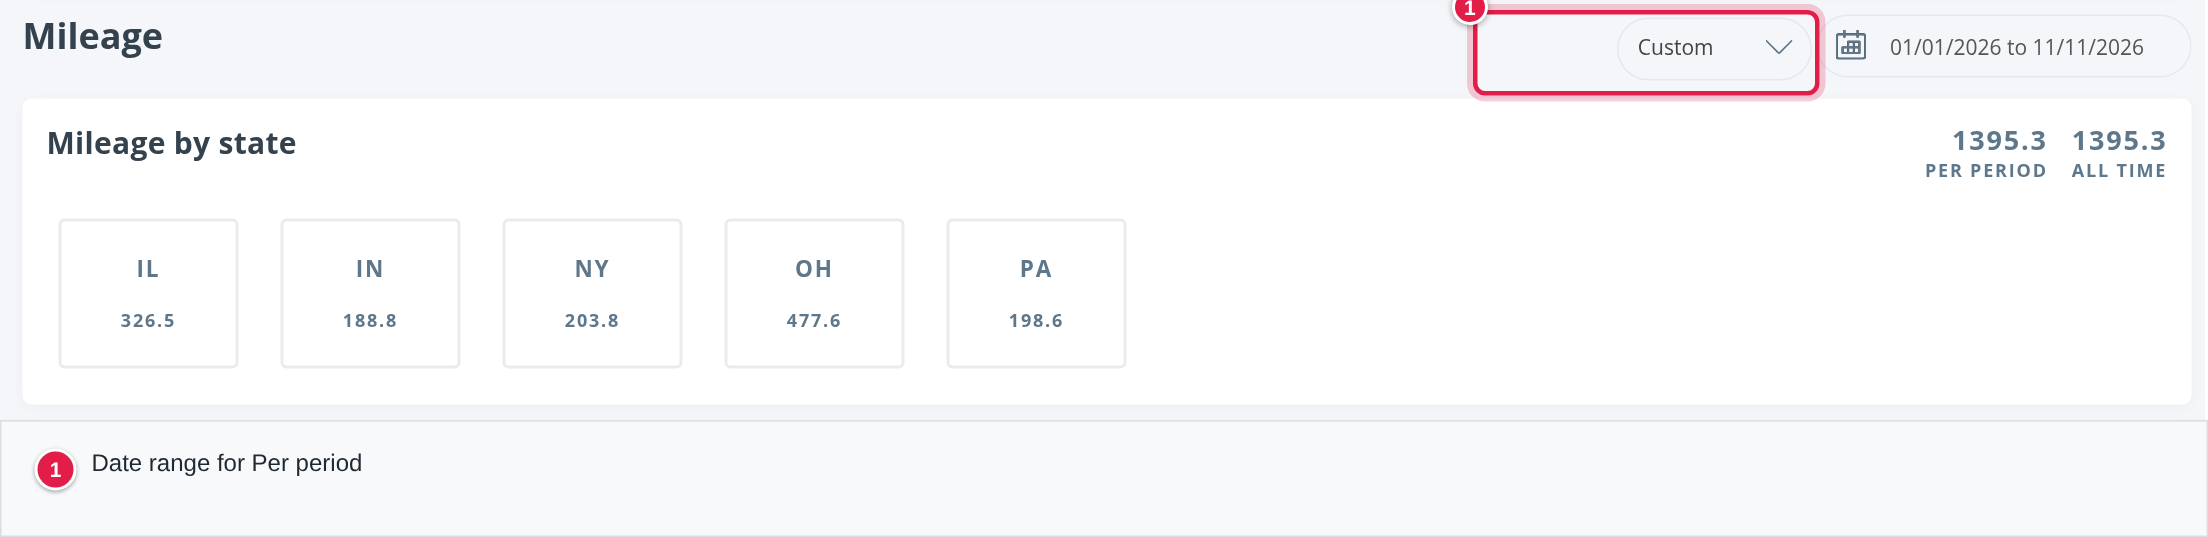
The Mileage tab shows Mileage by state: one box per state with the miles the driver drove in it. At the top right of the card:
- Per period: the miles in the chosen dates.
- All time: the miles since the driver's profile was created.
Change the date range to look at another period. It opens on the current year.
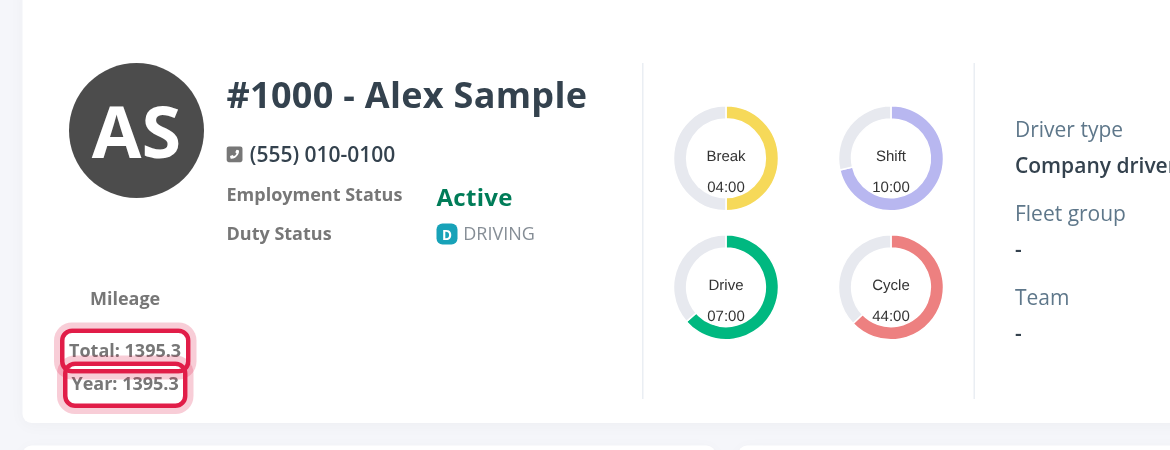
The Mileage box at the top of every tab
The top of every tab of the profile also has a Mileage box with Total (since the profile was created) and Year (this calendar year). It is the sum of the same miles by state.
Frequently asked questions
Was this article helpful?
That’s Great!
Thank you for your feedback
Sorry! We couldn't be helpful
Thank you for your feedback
Feedback sent
We appreciate your effort and will try to fix the article