Reviews shows how each fleet manager did in a pay period. There is one row per manager with the manager's drivers added together: loads, load types, revenue, fuel, driver pay, tolls, gross profit, miles, MPG and the per-mile numbers. Open a manager to see a statement with one row per driver, and use the Chosen drivers view to compare drivers of your own choice. This article also explains how every column and every line of the manager's statement is calculated, which numbers are saved and which are read live.
Who can do this: you need permission to open Reviews. By default that is Dispatcher, Capacity, Accounting and Safety users, plus Admin, and they can open the list and a manager's statement. Seeing everyone's reviews needs the separate permission Reviews All (by default only Admin and Superadmin). Without it you see only the row and the statement of the employee record that is linked to your own user, and nothing if none is linked. The Chosen drivers view is available by default to Dispatcher, Capacity and Admin users only; it is not part of the default Accounting or Safety roles. An account can override these defaults in its access settings.
Before you begin
A manager appears in Reviews only when all of this is set up:
- The manager is a user with an employee record linked to that user. See Staff.
- On the employee's Compensation card, the compensation type is commission and a payroll schedule is chosen. See Employee profile: Accounting and Statements tabs.
- The drivers have that manager as their Fleet Manager. See Driver profile: Overview tab.
- The manager's commission payroll for the period exists. It is built from the drivers' loads.
- The drivers' own payrolls for the same period exist. Loads, fuel, tolls, driver pay and miles are read from them.
Some numbers are saved on the manager's payroll when it is built, others are read live from the drivers' payrolls each time you open the page. If you change loads, the saved numbers follow only after the manager's payroll is rebuilt (use Reload on the statement, when the payroll is not locked). The live numbers follow as soon as the driver payrolls change. The section "Saved or live" below lists which is which.
Open Reviews
In the left menu, select Operations, then Reviews. The table stays empty until you choose a period.
Choose the period
- A period is one payroll period of a payroll schedule, and its first day is set in the schedule, not fixed. A weekly schedule starts on its First Day of Payroll (Sunday to Saturday if the first day is Sunday, Wednesday to Tuesday if it is Wednesday, and so on). The schedules are in Settings → Account → Payroll Schedules, where you also set Days to Pay. A monthly schedule runs from the first to the last day of the month.
- Under Actions you see, for each distinct payroll schedule that has managers, three blocks: the period that contains today and the two periods before it, for example Week #NN dd/mm/yyyy - dd/mm/yyyy and Due dd/mm/yyyy, or Month #NN for a monthly schedule. NN is the calendar week number (ISO) of the period's last day. Due is the last day plus the schedule's Days to Pay. Select a block to load that period.
- Previous Week and Next Week move the chosen dates by exactly seven days.
- Chosen drivers view (top right) opens the page that compares selected drivers.

The list
How the list is built. For the period you chose, the page takes every manager's commission payroll that starts and ends on exactly those dates (payrolls that were deleted are ignored). One payroll is one row. A manager whose drivers have no loads on their payrolls in the period is not listed. Without Reviews All the list is cut to your own row.
Type in Search to filter. Select a team name to search for it. The team column shows the team abbreviated (all words but the last are reduced to their first letter); hover to see the full team name. The buttons above the table are Edit columns, Show 50 rows (choose the number of rows) and Export, which downloads the visible columns and the footer row as an Excel file. The table starts sorted by Number Of Loads, highest first. Hover over a column title to read its tooltip.
The footer row adds up the rows on the current page only. Money columns in the footer show the size of the sum without a minus sign. Percentages, MPG and the per-mile numbers in the footer are recalculated from the page totals (not averaged): each percentage is the page's load or mile share, MPG is the page's Total Miles divided by Gallons, and $ Per Mile, Fuel Per Mile and Driver Per Mile are the page's Total, Fuel cost and Driver divided by Total Miles.
| Column | What it shows and how it is calculated |
|---|---|
| Eye icon | opens the manager's statement in a new tab |
| Name, Team | the manager (a link to the employee record) and the manager's team |
| Drivers | number of drivers saved on the manager's payroll, including drivers with no loads |
| Number Of Loads | loads on the drivers' payrolls for the period, added up (live) |
| % Contract, % Spot, % Dedicated, % Internal | loads of that type divided by Number Of Loads x 100, to one decimal. A load with no type is not counted in any of the four. |
| Linehaul Summary | the drivers' share of the linehaul on each load, added up. On a load with one driver it is the whole linehaul rate; on a load with several drivers it is each driver's share. Saved. |
| Fuel Surcharge | the fuel surcharge of each whole load, added up. Saved. |
| Detention | the driver's detention on each load; if that is 0, the detention of the whole load. Saved. |
| Lumper, Storage, Misc. | the amounts of each whole load, added up. Saved. Lumper is not in Total. |
| Total | Linehaul Summary + Fuel Surcharge + Detention + Storage + Misc. It is revenue, not cost, and does not include lumper or warehouse. Saved. |
| Fuel cost | for each driver payroll, the fuel card transactions on it: diesel amount minus discount plus the transaction's other fuel items. Reefer and cash advance are not included. Live. |
| Driver | the driver pay from the driver payroll: for per mile and flat rate drivers the pay plus accessorials plus extra income; for percentage drivers (linehaul + accessorials + detention of the payroll's loads, the first part of a mile split counted as 0) x the driver's percentage. Live. |
| Tolls | the driver's toll transactions dated from the first to the last day of the payroll (whole days), added up. Live. |
| Trip expenses | the driver's deductions marked as trip expense. Live. |
| Gross profit | depends on the driver's payroll type, see below. |
| Rating | the sales targets of the active drivers added up and divided by 1000. Saved. |
| Active | number of drivers whose linehaul in the period is more than $2,500. Saved. |
| Total Miles | for each driver, loaded miles plus empty miles from the driver's payroll, added up. Live. |
| Gallons | diesel gallons on the fuel card transactions of the drivers' payrolls. Live. |
| MPG | miles saved on the manager's payroll divided by Gallons, to two decimals. |
| % Loaded | (Total Miles minus Empty Miles) divided by Total Miles x 100, to one decimal. Live. |
| Empty Miles | the empty miles of the driver payrolls, added up. Live. |
| % Empty | Empty Miles divided by Total Miles x 100, to one decimal. Live. |
| $ Per Mile | Total divided by the miles saved on the manager's payroll, to cents. |
| Fuel Per Mile, Driver Per Mile | Fuel cost and Driver, each divided by the miles saved on the manager's payroll. |
| Accessorial Total | the drivers' accessorials on the loads of the driver payrolls, added up. Live. |
The miles saved on the manager's payroll are, for each driver and load, the loaded miles plus the empty miles recorded for that driver on the load. Loaded miles are the driver's planned route miles when the load has driver routes, otherwise the miles of the driver's stops on the load. The per-mile numbers use them, while Total Miles, Empty Miles, % Loaded and % Empty use the driver payrolls, so the two mile figures can differ a little.
Gross profit depends on the payroll type of each driver (also in the column tooltip):
- Company driver payroll (per mile): Linehaul Summary + Fuel Surcharge + Detention + Storage + the misc income of the driver payroll's loads, minus Fuel cost, Driver and Tolls.
- Owner operator payroll (percentage): Total minus Driver.
- Flat rate payroll: the gross of the payroll's loads minus Driver, Fuel cost, Trip expenses and Tolls.
- Other payroll types show $0.00.
The manager's row adds up the drivers.
Colors:
- Gross profit is green at or above the profit target, yellow from the break-even up to the target, and red below break-even. Targets and break-even are account settings per driver type: Company Gross Profit Target, OO Gross Profit Target, Leased Owner Op Gross Profit Target, Contract Gross Profit Target and the matching Breakeven fields, in Settings → Preferences → Operations → General, in the Cost & Profitability section. On the list the color follows the type of the manager's first driver, so treat it as a hint; on the statement and in the Chosen drivers view each driver uses his or her own type.
- % Empty turns yellow above 15, orange above 20 and red above 25. The footer is colored the same way.

Saved or live
- Saved on the manager's payroll when it is built (and again when you select Reload): Drivers, Linehaul Summary, Fuel Surcharge, Detention, Lumper, Storage, Misc., Total, Rating, Active and the miles used by MPG, $ Per Mile, Fuel Per Mile and Driver Per Mile.
- Read live from the drivers' payrolls every time you open the page: Number Of Loads and the type percentages, Fuel cost, Gallons, Driver, Tolls, Trip expenses, Accessorial Total, Total Miles, Empty Miles, % Loaded and % Empty.
- Gross profit mixes both: the revenue parts are saved, the fuel, driver pay, tolls and misc income are live.
A manager's statement
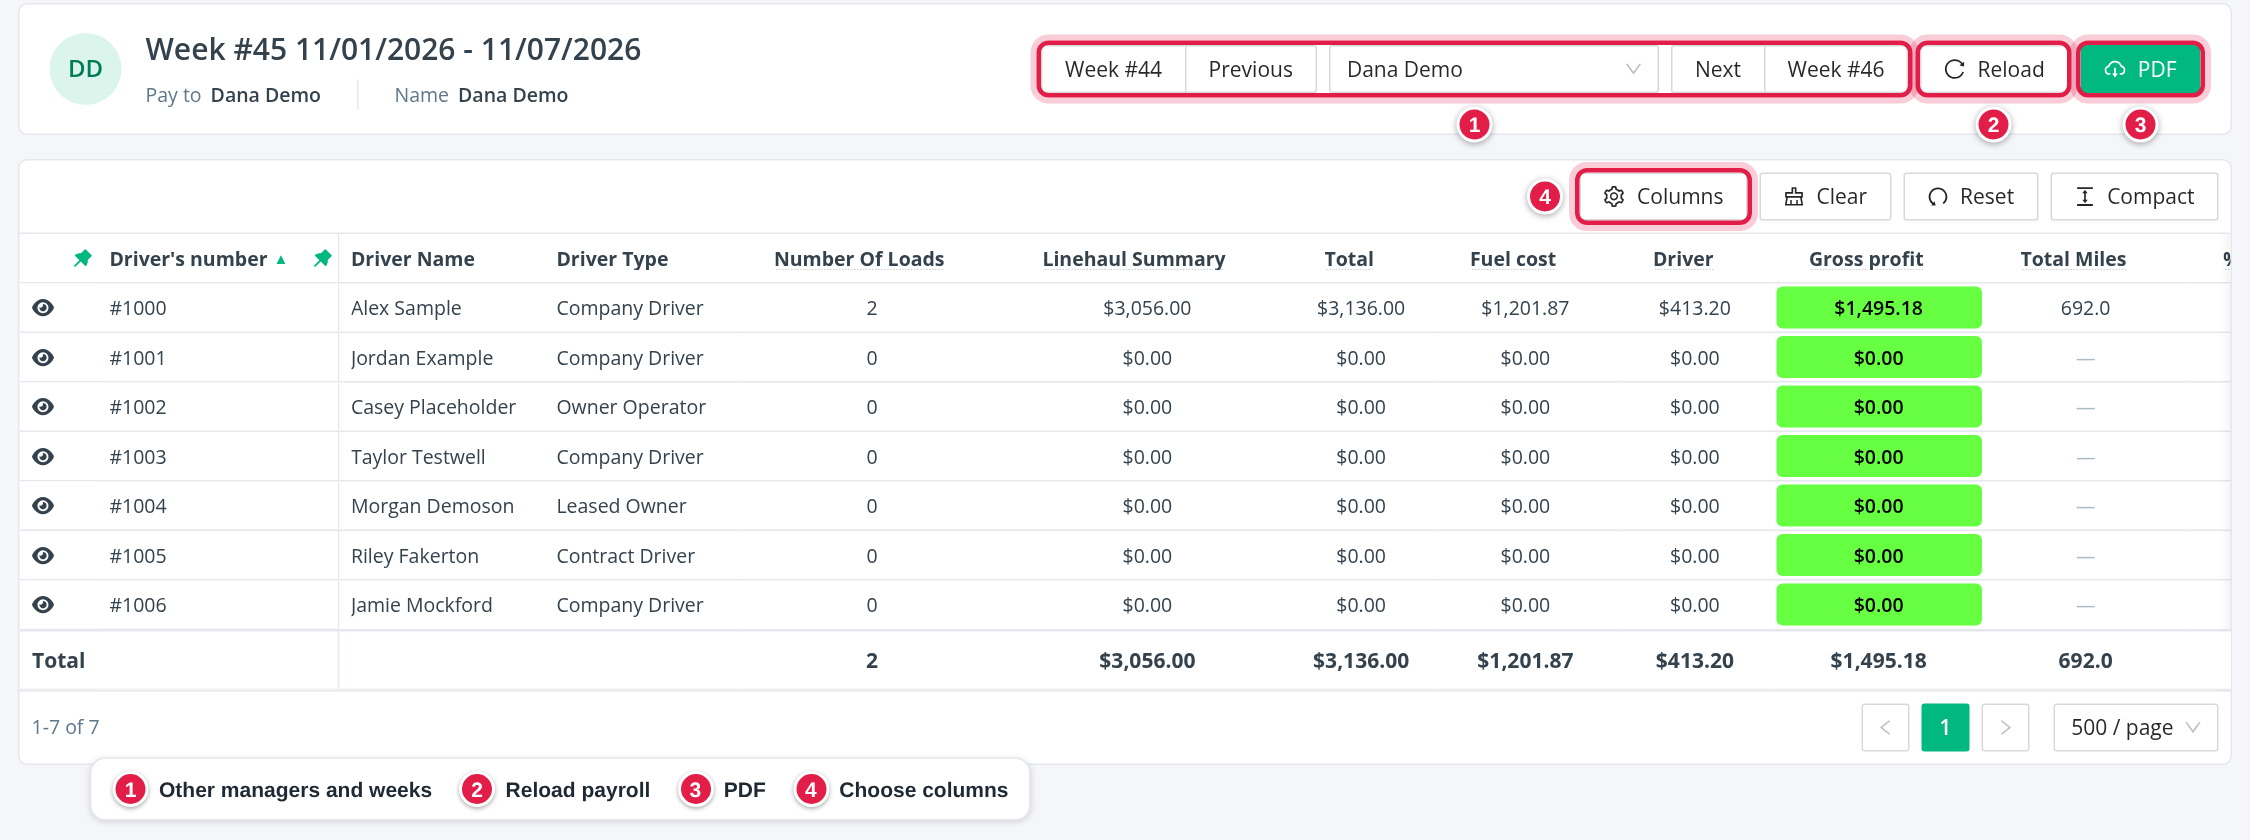
Select the eye icon. The statement shows the title (Week #NN with the period dates), Pay to (the employee's Pay To) and Name, and one row per driver with a Total row. Rows are sorted by driver number and all rows are shown on one page.
- Previous, Next, the manager list and the buttons for the previous and next period (Week #NN) are shown only with Reviews All. Without it you can open only your own statement.
- Reload rebuilds the manager's payroll with current data. It is shown if you may refresh payrolls and the payroll is not locked. PDF downloads the statement as a PDF (see below).
- Use Columns to choose the columns; Reset returns to the defaults. By default you see Driver's number, Driver Name, Driver Type, Number Of Loads, Linehaul Summary, Total, Fuel cost, Driver, Gross profit, Total Miles, % Empty, LH RPM and All-In RPM. The other columns of the list are available too, except Team, Drivers and $ Per Mile.
- Per driver the numbers are calculated as in the list table above. In addition: LH RPM = Linehaul Summary divided by Total Miles, and All-In RPM = (Linehaul Summary + Fuel Surcharge + Detention + Accessorial Total) divided by Total Miles, both to cents. MPG, Fuel Per Mile and Driver Per Mile use the driver's miles saved on the manager's payroll.
- Rating is the driver's own sales target and Active is Yes or No (linehaul over $2,500). A driver with no driver payroll that week shows 0 loads and a dash for the mile columns.
- The Total row adds up the drivers. Its Rating is the active drivers' sales targets divided by 1000, so it is not the sum of the targets shown on the rows. Its MPG, Fuel Per Mile and Driver Per Mile use the miles saved on the manager's payroll.
- A trash icon appears on a driver who was moved from another manager. It deletes that driver assignment after Delete this driver assignment?
Which loads are in a statement. A driver appears on a manager's statement only when the manager is the driver's Fleet Manager. For each driver, the loads counted are those whose last delivery by that driver has a date inside the period, that are not canceled and that are not child loads of a split load. A disabled driver with no linehaul that week is left out.
What the PDF shows
The PDF is the manager's earnings statement for the period.
- Settlement Date: the last day of the period plus the schedule's Days to Pay.
- Driver table: for each driver, Sales target (the driver's sales target), Target (the sales target when the driver is active, otherwise 0), Linehaul Summary, Detention, Active, Qualifying Sales, Miles (loaded plus empty miles saved), $ Per Mile (Linehaul Summary divided by Miles) and Over Target.
- A driver is active when the linehaul of the period is more than $2,500. - Qualifying Sales = the driver's linehaul if the driver is active, otherwise 0, plus the driver's detention in every case. - Over Target = Qualifying Sales minus Target. The last row adds up each column.
- Team box (team name): Total Booked Revenue = linehaul rate plus detention of all the manager's loads delivered in the period. Fleet Sales = linehaul rate of the loads where the manager is the fleet manager (including loads of temporarily assigned drivers). Outside Sales = Total Booked Revenue minus Fleet Sales. Team Gross Goal = the sales targets of the team's active drivers. Team Sales = the linehaul of the team's active drivers plus the detention of all the team's drivers. Over Target = Team Sales minus Team Gross Goal.
- Earnings box:
- Minimum = the employee's Weekly Minimum. - Sales = the sum of the drivers' Qualifying Sales x the employee's Sales percent. It is 0 when no percent is set. - Bonus = Outside Sales x the employee's Outside Sales percent. It is 0 when no percent is set. - Team Bonus = (Team Sales minus Team Gross Goal) x the employee's Team Sales percent, divided by the number of payrolls of that team in the period. It is 0 when the team is not over its goal or no percent is set. - Adj = the sum of the employee's adjustments and deductions for the period (positive and negative). - Settlement = the larger of Sales and Minimum, plus Bonus, plus Team Bonus, plus any fees on the payroll, plus Adj. The percents and the minimum are on the employee's Compensation card.
Example (invented numbers): the manager has two drivers. Driver A has $3,000 linehaul and $100 detention and is active, so Qualifying Sales is $3,100. Driver B has $2,000 linehaul and $50 detention and is not active, so Qualifying Sales is $50. Together $3,150. With Sales 20 percent that is $630, which is above a Minimum of $500, so $630 counts. Total Booked Revenue of $12,000 with Fleet Sales of $2,000 gives Outside Sales of $10,000; with Outside Sales 1 percent the Bonus is $100. If the team is $2,000 over its goal, the Team Sales percent is 2 and the team has 4 payrolls, the Team Bonus is 2,000 x 2% / 4 = $10. With Adj of minus $25, the Settlement is 630 + 100 + 10 - 25 = $715.
Chosen drivers view
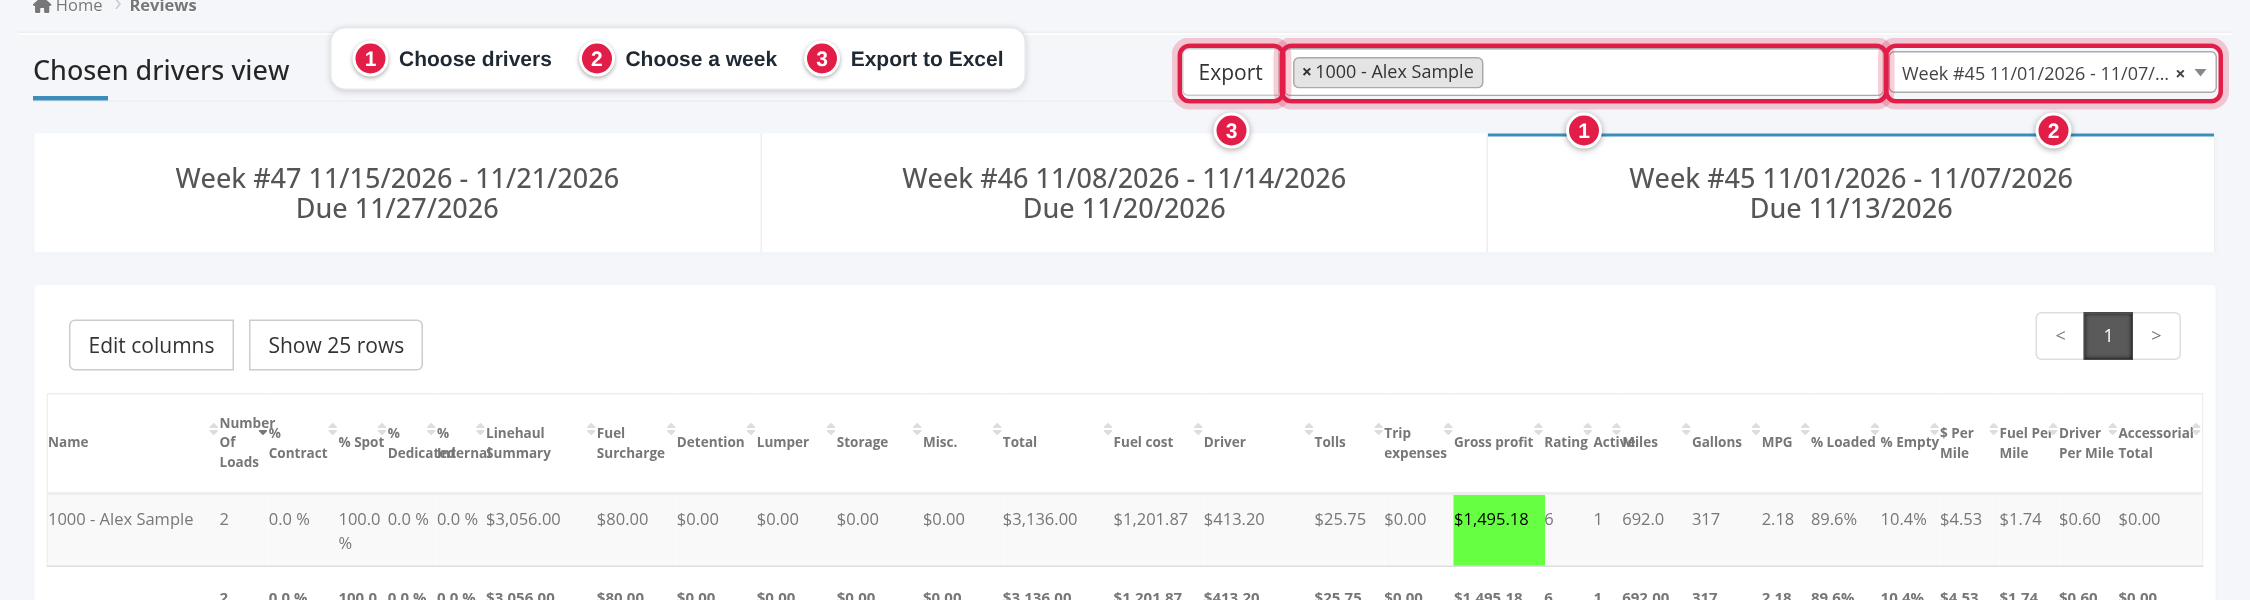
Select Chosen drivers view, choose the Drivers (active and suspended drivers, as number and name) and a Week (the 31 most recent periods of the first payroll schedule that has managers, starting with the period that contains today), and the table shows the numbers per driver, with Name (number and name) first. The numbers are calculated as in the list, one row per driver and manager payroll of that exact period, so a driver who is on the payrolls of two managers in the period appears twice. The columns are like the list without the eye icon, Team, Drivers and Empty Miles; Miles is the driver's Total Miles, Rating is the driver's sales target divided by 1000 when the driver is active (otherwise 0) and Active is 1 or 0. The table is sorted by Number Of Loads, shows 25 rows (Show 25 rows), can be searched and has Edit columns. Use Export to download the selection as an Excel file with all columns. With no driver or no week chosen the table is empty. Without Reviews All you see only drivers who are on your own manager payroll.
Where each number comes from
| Number | Calculation | Data and dates | Saved or live | What you can change |
|---|---|---|---|---|
| The period | One payroll period of a schedule | Schedule First Day of Payroll, Days to Pay | - | Settings → Account → Payroll Schedules |
| Which managers | Commission payrolls with those exact dates and at least one load | Manager payroll, drivers' payrolls | Saved + live | Employee compensation, driver Fleet Manager, payroll schedule |
| Linehaul Summary, Total and the charges | Sums over the loads of the driver's last delivery in the period | Loads, per-driver linehaul share | Saved | Load amounts and driver split, then Reload |
| Number Of Loads, type % | Count of loads on the driver payroll | Driver payrolls | Live | Driver payrolls |
| Fuel cost, Gallons | Diesel amount - discount + other; gallons | Fuel card transactions on the driver payroll | Live | Fuel on the payroll |
| Driver | Pay from the driver payroll | Driver payroll and compensation | Live | Driver compensation, payroll |
| Tolls | Sum of toll transactions of the payroll days | Driver's tolls | Live | Toll transactions |
| Gross profit | Depends on payroll type | Saved revenue, live costs | Mixed | Payroll type, costs |
| Rating, Active | Targets of active drivers / 1000; linehaul over $2,500 | Driver sales target, linehaul of the period | Saved | Driver sales target |
| Total Miles, Empty Miles, % Loaded, % Empty | Miles + empty miles from the driver payroll | Driver payrolls | Live | Payroll miles |
| MPG, $ Per Mile, Fuel Per Mile, Driver Per Mile | Divided by the miles saved on the manager's payroll | Saved miles with live fuel and driver pay | Mixed | Reload the payroll |
| LH RPM, All-In RPM | Linehaul (+ charges + accessorials) / Total Miles | Statement only | Mixed | - |
| Earnings lines in the PDF | Sales, Bonus, Team Bonus, Minimum, Adj, Settlement | Employee compensation percents, saved payroll | Saved | Compensation card, then Reload |
FAQ
Was this article helpful?
That’s Great!
Thank you for your feedback
Sorry! We couldn't be helpful
Thank you for your feedback
Feedback sent
We appreciate your effort and will try to fix the article