Stats is a page of charts. It shows how many loads your team entered, how much linehaul they carry, fuel prices, pick-ups and deliveries by weekday, pay per mile, MPG, miles, maintenance cost, sales by load type, team goals, driver mix and equipment ownership. Nothing on the page changes your data, and there are no tables or exports. This article explains, chart by chart, where each number comes from, which dates it uses and what you can change.
Who can do this: you need permission to open Stats. By default that is Dispatcher, Capacity, Accounting and Safety users, plus Admin. Most charts load their numbers separately, and each of those needs its own permission, so a user whose role lacks the permission for one chart sees that chart empty. By default the Driver Types chart is available to Admin users only. An account can override these defaults in its access settings.
Before you begin
- Several charts are built from driver payrolls and from the fuel card transactions that sit on those payrolls. Create the payrolls and import the fuel card transactions first, or those charts are empty or estimated. See Processing Driver Statements.
- The EDI Loads chart shows only when EDI is switched on for your account.
Open Stats
In the left menu, select Operations, then Stats.
How dates, weeks and refreshing work
- A week always runs Sunday to Saturday. This is fixed for the whole application. It is not an account setting. "This week" is the current Sunday to Saturday week and "last week" is the one before it, both in your account's time zone.
- Payroll based charts use the week of the payroll's end date. Charts about pay per mile, MPG, miles, fuel cost and fuel adjusted pay per mile place each driver payroll in the Sunday to Saturday week that contains the payroll's end date. A payroll that ends on a Friday counts for the week of that Friday, even if it started earlier or some of its loads were delivered in another week.
- Charts with month boxes (mm/yyyy): choose the first and last month and select the green Update button to reload that chart. Week based charts then cover whole weeks, from the week that contains the first day of your first month to the week that contains the last day of your last month. Total Linehaul Rate, the gallons charts, Hourly Truck Stats and the ownership charts reload the whole page instead.
- Default ranges: most week based charts start two months back and end with the current month. Total Linehaul Rate and Sales Distribution end one month ahead. The gallons charts run from January of this year to the end of this month. The ownership charts show the whole current year.
- Team Goals has a week box. Choose any date; the chart shows the Sunday to Saturday week that contains it. Hourly Truck Stats has a date box.
- Stats refresh rate: the page can reload itself. Choose how often (in seconds) in the small box in the top bar, or in your profile (Stats refresh rate). The choices are 0 and 15 to 120 in steps of 5. 0 switches it off. It is saved per user.
- Live or saved: every chart is calculated from the current data each time it loads, except the ownership charts for past months and Hourly Truck Stats, which show saved snapshots (described below). Payroll based charts use what is on the payrolls right now, so they change when payrolls are rebuilt or edited.
The top tiles
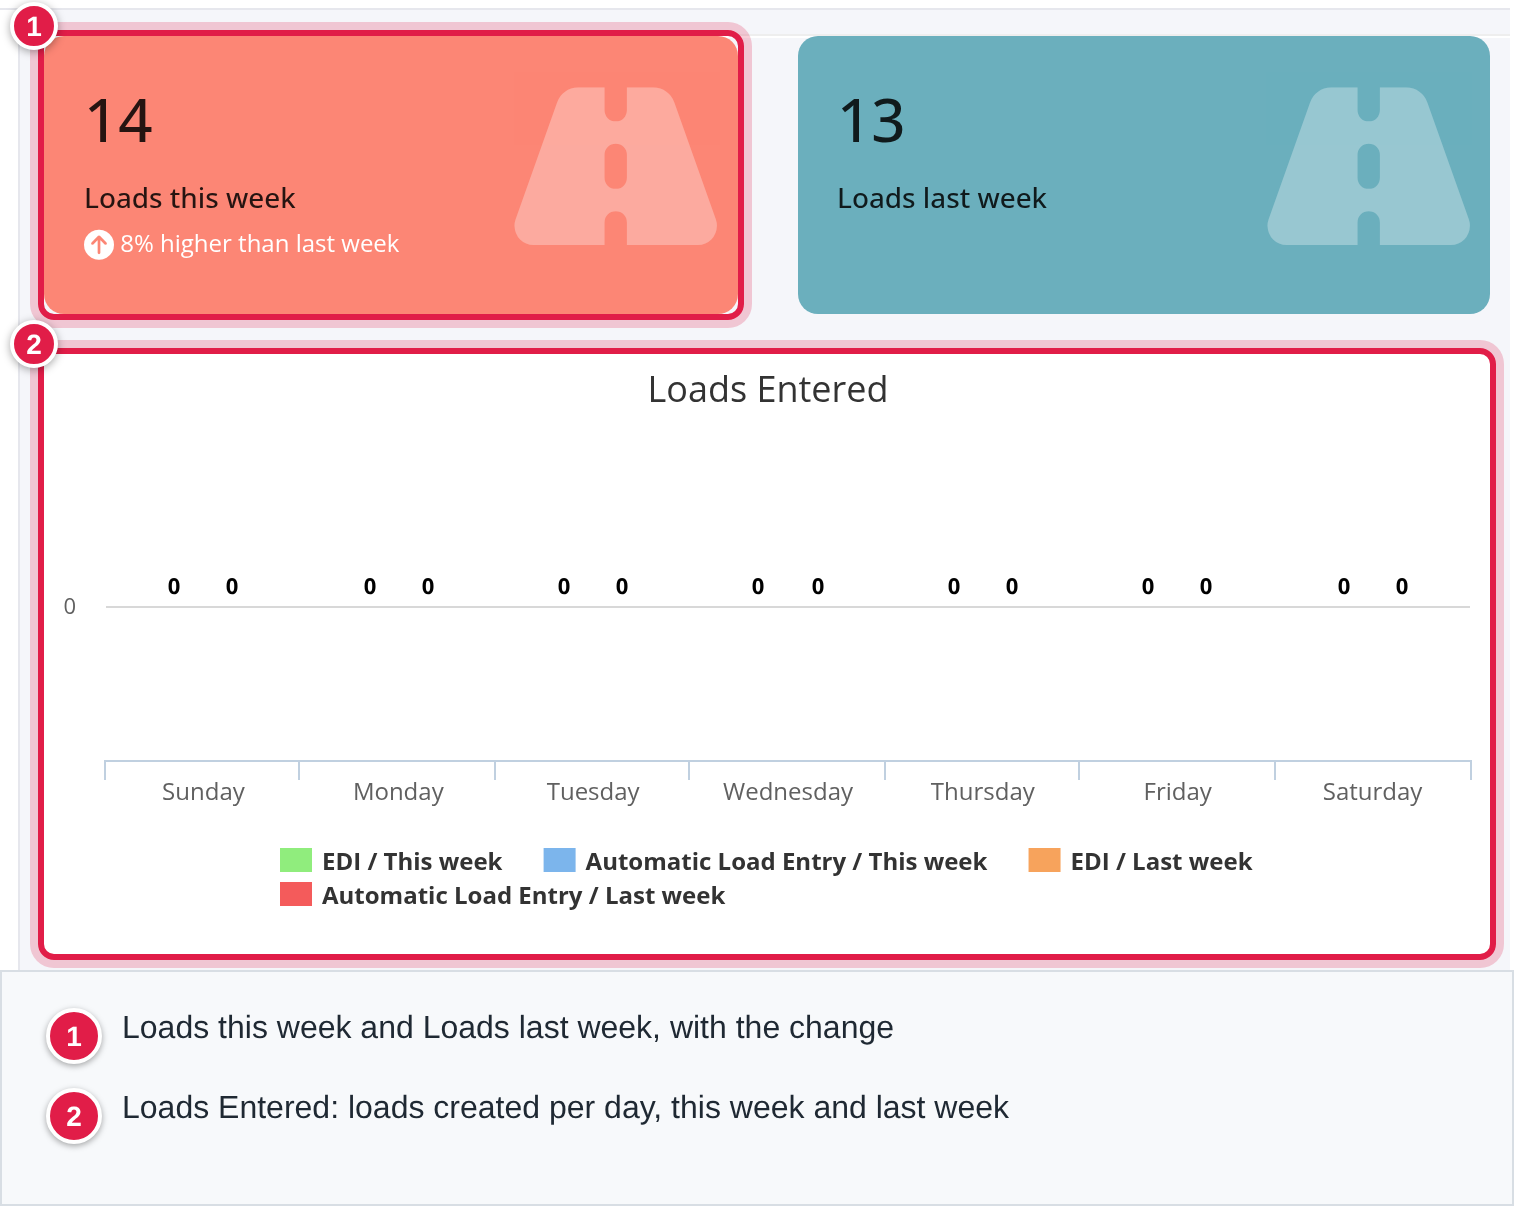
Loads this week and Loads last week count the loads created in each week (not delivered), using the creation record of each load, by the day and time it was first saved in your account's time zone. Canceled loads are counted too.
Under Loads this week you see how it compares with last week. The page divides this week's count by last week's count, multiplies by 100 and rounds to a whole percent:
- Above 100: N% higher than last week, where N is that percent minus 100, with an up arrow.
- Below 100: N% lower than last week, where N is 100 minus that percent, with a down arrow.
- Exactly 100 after rounding: No changes this week.
- Both weeks 0: No changes. This week 0 only: No loads this week. Last week 0 only: No loads last week.
Example (invented numbers): 14 loads this week and 13 last week give 14 / 13 x 100 = 107.7, rounded to 108, so the tile shows 8% higher than last week.
Charts about loads
- Loads Entered: columns for each weekday (Sunday to Saturday) for last week and this week, stacked. Each load is counted on the day it was created and belongs to the user who created it, so there is one color per user. EDI counts the loads created by EDI. Automatic Load Entry counts loads created in that week that came from an automatic load entry tender. Hover over a day to see every series of that week. Canceled loads are included.
- Linehaul Entered by Date: for each weekday, the sum of the linehaul rate of loads created that day, last week against this week. Fuel surcharge and other charges are not included. Canceled loads are not counted. Amounts are as they are on the loads now.
- Delivered by Date and Picked up by Date: the money on loads delivered or picked up each day (Sunday to Saturday), last week and this week, stacked as Fuel Surcharge, Linehaul Rate, Lumper, Storage and Misc. A load counts once, on the day of its last stop when that stop is a delivery, or on the day of its first stop when that stop is a pick-up, using the date of that stop. For each load the amounts are the whole load's amounts as they are now (detention and warehouse are not part of these charts). Canceled loads, LTL loads and deleted stops are left out. Under each chart a line Total this week: and Total last week: gives the sum of all five amounts for that week.
The two total lines are placed under the opposite chart. The totals shown under Delivered by Date are the picked-up totals, and the totals shown under Picked up by Date are the delivered totals. Read the chart titles, not the position of the totals.
- Delivered by Date Count and Picked up by Date Count: the number of loads counted by the same rules, per weekday, last week and this week. A weekday with no stops does not appear.
- EDI Loads: the loads with a customer that came in by EDI, created this week and last week, one color per customer.
Charts about fuel
All fuel charts use the fuel card transactions of your account, by the transaction date. The price per gallon is always: (sum of diesel amount minus sum of discount) divided by the sum of diesel gallons, rounded to cents. Transactions are not weighted any other way.
- Fuel Prices: that average for Today, Yesterday (each a calendar day in your account's time zone) and All time (every transaction of the account). A day with no transactions shows 0.
- Fuel Price and Discount: the same price for today and yesterday, and the discount per gallon (sum of discount divided by sum of diesel gallons) for today and yesterday.
- Fuel Cost by Month: the same price for each month of this year against last year, by the month of the transaction date.
- Monthly Gallons by Driver Type: diesel gallons per month (by transaction date) for transactions of Contract driver, Leased Owner Op, Company driver and Owner operator drivers, using the driver's current type, and Fuel Customers for transactions assigned to a customer. The hover box shows the month total.
- Monthly Gallons by Merchant: diesel gallons per month at Pilot, Loves and Other, by the merchant type recorded on the transaction. Other is everything that is neither Pilot nor Loves.
Charts about pay per mile, miles and fuel efficiency
These charts use the driver payrolls, grouped by the payroll's end date as described above. A load that is not yet on any driver payroll is missing from them. Each load is counted once, on the most recent payroll it is on within the dates you choose. Amounts and miles are read from the loads as they are now, not from a saved copy.
- Weekly $ Per Mile (Loaded Miles):
- $ Per Mile = (linehaul + fuel surcharge + detention + storage + misc of the loads) divided by the loaded miles of those loads, rounded to cents. Lumper and warehouse are not included. Empty miles are not included. - Fuel Adjusted $ Per Mile = $ Per Mile minus (fuel cost per gallon divided by MPG), rounded to cents. The fuel cost per gallon and the MPG are the company driver numbers of the same week (see the next charts). - If a week has no fuel transactions on company driver payrolls, the page uses the average of the last three weeks that have fuel, as long as there is no later week in the chart. If the MPG for the week is 0 or missing, the adjusted number equals $ Per Mile. A week with no loaded miles shows 0. - The latest week is marked Estimate when your date range reaches the current week, because its MPG is an estimate (see Weekly Company Driver MPG).
- Contract vs. Spot Weekly $ Per Mile (Loaded Miles): the same $ Per Mile calculation (without the fuel adjustment), separately for loads of type Contract, Spot, Dedicated and Internal. A load with no type counts as Contract. A week with no loads of a type shows a gap.
- Weekly Company Driver MPG: for each week, (miles + empty miles of the payrolls of company drivers) divided by the diesel gallons on the fuel card transactions attached to those payrolls, rounded to two decimals. Only drivers whose current type is Company driver are included. When your range reaches the current week, the most recent week is not calculated but estimated: the average of the MPG of the up to three weeks before it (and only when there is more than one week). Weeks after the current week are not shown.
- Weekly Company Driver Fuel Cost: Fuel Cost Per Gallon for each week: (diesel amount minus discount) divided by diesel gallons, only for the fuel card transactions attached to company driver payrolls of that week, rounded to cents. A week with no gallons shows 0.
- Weekly Fuel Adjusted $ Per Mile (Loaded Miles): the fuel adjusted number above, by week number (Week #N), as one line per year: this year and the four years before it. For each earlier year the page uses the same months you chose, shifted back by the number of years.
- Weekly Total Miles: the total miles of all driver payrolls ending in that week: loaded miles plus empty miles, summed and rounded to whole miles.
- Total Linehaul Rate: one column per payroll period (written as start date - end date, not forced to Sunday to Saturday), stacked as Leased Owner Op, Company drivers and Owner operators/Contract drivers. Each amount is the gross of the driver payrolls of that type for the period, which is the sum of the linehaul amounts of the loads on those payrolls. The hover box shows the amount per type and the Total of the period. The Total: next to the chart adds up all four driver types over the whole range. Types are those of the drivers now. A future end month stops at the end of the current week.
- Sales Distribution: one column per payroll period (start date - end date) with two stacks. The first stack splits the period by what it is made of: Linehaul Rate (the linehaul amount of the loads on driver payrolls), Fuel Surcharge, Lumper, Storage, Misc., Detention and Warehouse. The second stack splits the same money by load type: Spot, Contract, Dedicated and Internal. For the type stack the hover box also shows each type's percent of the column. The Total: next to the chart is the sum of all seven components over all periods. Only loads with a contract/spot type are counted in the linehaul part. The extra charges (everything except linehaul) of a load already on the previous period's payroll are not counted again. Amounts come from what was saved on the payroll when it was built.
Charts that use payrolls need payrolls to exist for the weeks you look at. Fuel and MPG charts need fuel card transactions on those payrolls.
Charts about your fleet and team
- Team Goals (Week N Team Goals, where N is the calendar week number of the date you chose): one group of columns per team, with the Team Goal, Team Sales, $ per mile Goal and $ per mile Actual. The week is the Sunday to Saturday week of the chosen date. A team is the Team name entered on active users, and its drivers are the drivers whose fleet manager belongs to the team and has a payroll for that week, plus drivers temporarily assigned to those managers, minus drivers temporarily assigned away. The numbers use the loads whose delivery stop falls in the week and are not canceled, per driver:
- A driver is counted as active when the linehaul of those loads is more than $2,500. The driver's share of a load's linehaul is used (the whole linehaul if the driver is alone on the load). - Team Goal = the sum of the sales targets of the active drivers. - Team Sales = the linehaul of the active drivers plus the detention of all the team's drivers, rounded to cents. - $ per mile Actual = the linehaul of all the team's drivers divided by their loaded plus empty miles, rounded to cents. - $ per mile Goal = the account setting Team $ Per Mile Goal (in Settings → Account → Passwords), the same for every team. - Teams with no sales and no $ per mile are hidden.
- Weekly Maintenance Cost: one column per Sunday to Saturday week. The colored parts are the costs on truck and trailer service logs, one color per type of line item (named Truck ... or Trailer ...), placed in the week of the log's invoice date. The two estimate parts, Estimated truck repairs and Estimated trailer repairs, are the estimated cost of completed service logs in the week of their time out. The Total: next to the chart adds the invoiced truck and trailer costs for the whole range and does not include the estimates.
- Driver ELD Compliance: the number of active drivers for each compliance type (for example ELD (Samsara), Keep Truckin, Time Sheets). Drivers with no compliance type are shown as None.
- Driver Types: the number of active drivers by type: Company Driver, Owner Operator, Leased Owner Op and Contract Driver. Each type has three slices: drivers of the type marked neither team nor local, drivers marked as team drivers and drivers marked as local drivers. A driver marked both team and local is not shown in any slice. Hover for the percent of the whole.
- Hourly Truck Stats: for the date you choose (today by default), Available and Planned counts at each saved time of that day. They are saved snapshots, not recalculated: a scheduled job stores, for each snapshot, the number of planned drivers for the day and the number of available drivers who are not planned. The chart is empty for a date with no snapshots.
- Truck Ownership Type and Trailer Ownership Type: the number of active trucks or trailers for each month, stacked by Ownership type (for example Financed, FMV Lease, Fully Own, Operating Lease, TRAC Lease, Trip Lease, Owner Operator Owned). Equipment without an ownership type is shown as None. The current month is live: it counts the active equipment now. Past months are saved snapshots that a scheduled job stores; a month with no snapshot shows 0. The hover box shows the total.
Where each number comes from
| Number or chart | Calculation | Data and dates | Live or saved | What you can change |
|---|---|---|---|---|
| Loads this week / last week | Count of loads created in the week | Creation record of each load, Sunday to Saturday, account time zone, canceled included | Live | Nothing on the page; load entry |
| N% higher/lower than last week | (this week / last week x 100) rounded, minus or from 100 | Same two counts | Live | - |
| Loads Entered | Loads created per weekday and user; EDI and Automatic Load Entry as separate series | Creation records, last and this week | Live | - |
| Linehaul Entered by Date | Sum of linehaul rate of loads created that day | Loads, not canceled | Live | - |
| Delivered / Picked up by Date | Sum of fuel surcharge, linehaul, lumper, storage and misc of loads by delivery or pick-up day; totals under the charts | Last stop (delivery) or first stop (pick-up) date; not canceled, not LTL | Live | Stop dates and load amounts |
| Delivered / Picked up Count | Number of those loads per weekday | Same | Live | - |
| EDI Loads | Loads by customer created by EDI | Loads with a customer, this and last week | Live | - |
| Fuel Prices / Price and Discount / Cost by Month | (diesel amount - discount) / gallons; discount / gallons | Fuel card transactions by date | Live | Fuel card transactions |
| Monthly Gallons | Sum of diesel gallons by month | Fuel card transactions, by driver type, customer or merchant | Live | - |
| Weekly $ Per Mile | (linehaul + fuel surcharge + detention + storage + misc) / loaded miles | Loads on driver payrolls, week of payroll end date | Live from loads | Payrolls, load amounts, miles |
| Fuel Adjusted $ Per Mile | $ Per Mile - fuel cost per gallon / MPG | Company driver payrolls and their fuel | Live; last week estimated | Fuel card transactions on payrolls |
| Contract vs. Spot | Same, split by load type | Loads on driver payrolls | Live from loads | Load type |
| Weekly Company Driver MPG | (miles + empty miles) / diesel gallons | Company driver payrolls and their fuel | Live; latest week estimated | Payroll miles, fuel |
| Weekly Company Driver Fuel Cost | (diesel amount - discount) / gallons | Fuel on company driver payrolls | Live | Fuel on payrolls |
| Weekly Total Miles | Sum of miles + empty miles, rounded | Driver payrolls by end date | Live | Payrolls |
| Total Linehaul Rate | Sum of payroll gross by driver type | Driver payrolls by period | Live | Payrolls, driver type |
| Sales Distribution | Sums of load amounts by component and by load type | Driver payrolls by period; saved on the payroll | Saved on payroll | Rebuild the payroll |
| Team Goal / Team Sales | Sum of targets; linehaul of active drivers + detention | Deliveries in the week, drivers over $2,500 | Live | Driver sales target, teams |
| $ per mile Goal / Actual | Setting; team linehaul / miles | Account setting; deliveries in the week | Live | Team $ Per Mile Goal (Settings, Account, Passwords) |
| Weekly Maintenance Cost | Sum of line items by type; estimates separate | Service logs, invoice date and time out | Live | Service logs |
| Driver ELD Compliance / Driver Types | Count of active drivers | Driver records | Live | Driver compliance, type, team/local |
| Hourly Truck Stats | Available and planned counts | Saved snapshots | Saved | - |
| Ownership Type charts | Count of active equipment by ownership type | Past months saved, current month live | Both | Equipment ownership type |
FAQ
Was this article helpful?
That’s Great!
Thank you for your feedback
Sorry! We couldn't be helpful
Thank you for your feedback
Feedback sent
We appreciate your effort and will try to fix the article